Attribute Swimlane Graph
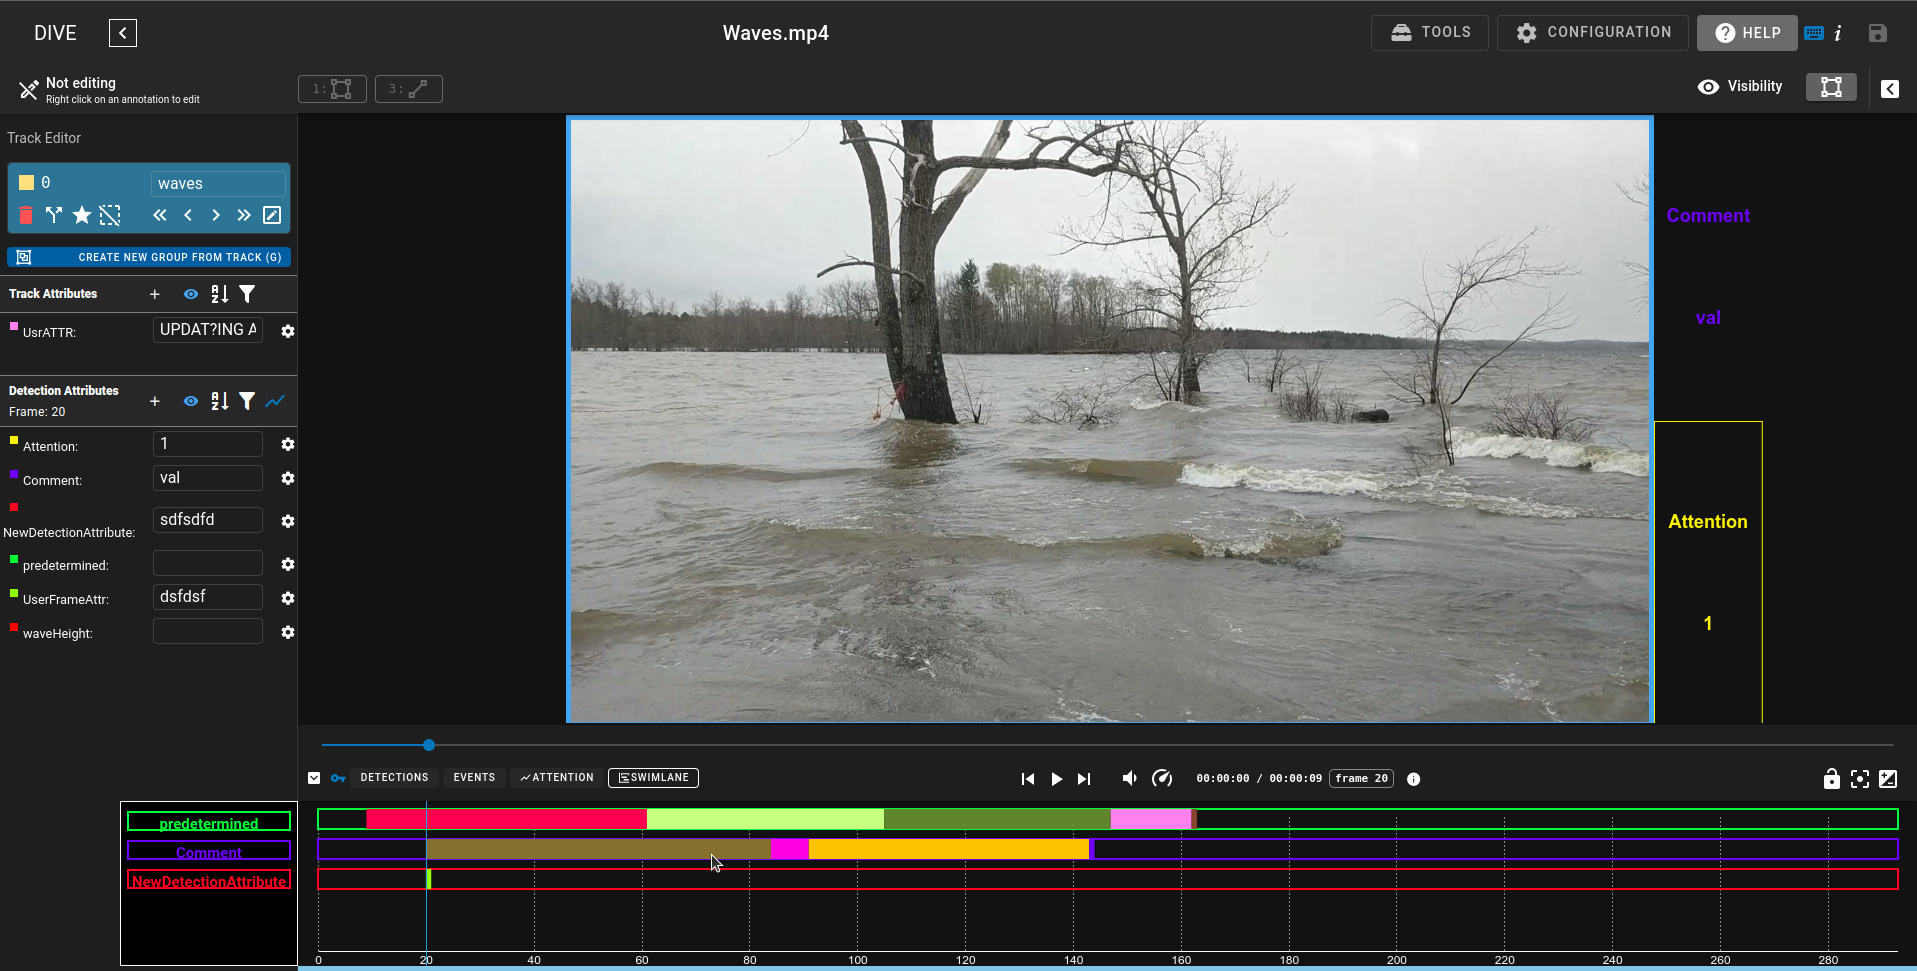
Attributes of type string can also be graphed in the timeline where each attribute has a swimlane where the values change over time.
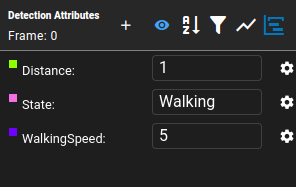
Swimlanes are configured similar to the Numerical Timelines for Detection attributes. In the Attributes setting there is a swimlane icon which can be clicked to open the side bar to the swimlane attributes settings.
Swimlane Timeline Graphs
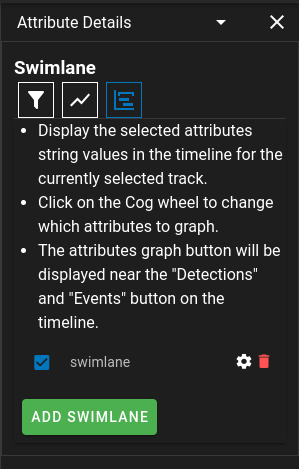
Multiple swimlanes can be added and enabled from this menu and existing ones can be modified.
Clicking on the settings will bring up the Settings Editor for attributes.
Display Settings
Display settings control when a swimlane appears and how values are drawn in the timeline.
Track type visibility
You can limit the timeline display based on track type. Set the display mode to Selected and choose which track types should show the swimlane. This lets you use different swimlane graphs for different track types.
Other display options:
- Display Set Value Indicators — show diamond markers on frames where values are set.
- Display Swimlane Tooltip — show attribute name and value when hovering over the swimlane.
Title & Key
Expand the Title & Key section in the swimlane settings dialog to control section titles and legend labels:
- Hide Swimlane Title — removes the section title above the chart to save vertical space.
- Hide Key Title — hides the swimlane graph name in the legend column.
- Hide Attribute Labels in Key — hides attribute names in the legend column (colored borders remain).
Under Key Label Settings, each applied attribute has a Show 'name' in key checkbox to control whether that attribute name appears in the legend column.
When a swimlane graph has a single attribute with the same name as the graph, the legend automatically shows that name only once.
Render Mode
Each swimlane has a Render Mode that controls how value colors are drawn across frames. Use the help icon next to Render Mode in the swimlane settings dialog for a quick summary.
- Classic — Extends each value's color forward from the keyframe where it was set until the value changes on a later keyframe. This is the default and works well when sparse keyframe data should visually persist across frames.
- Segments — Shows explicit start/end regions for each value. Supports Highlight Segments and Edit Segments so regions can be adjusted directly in the timeline. Minimum Frame Segment Size controls behavior when a segment is resized to zero.
- Discrete — Shows color only on keyframes where a value is explicitly set. Does not extend color across intermediate frames.
Tip
Use Discrete when you only want to see exactly where values were annotated. Use Classic when you want to see how a value persists over time. Use Segments when you need to view or edit value regions with explicit boundaries.
Swimlane Settings
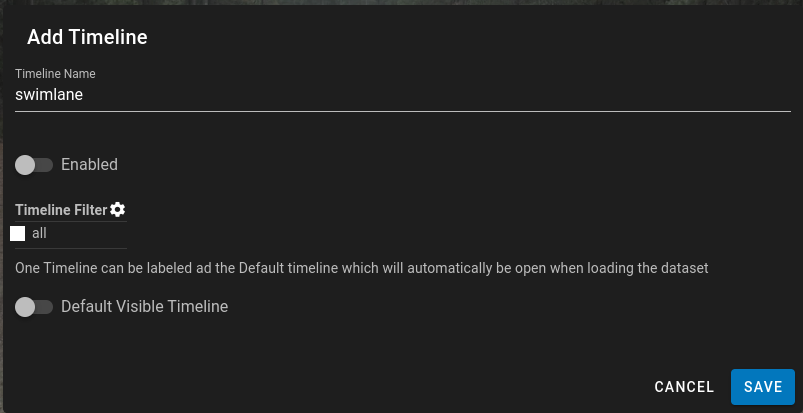
Use the key filter to select the attributes you wish to graph and configure the swimlane to be enabled or set as the default graph shown in the timeline area.
If you are creating a swimlane for a numerical attribute, use Value Colors to create a color gradient for the values.
For text attributes in swimlanes, color resolution follows the Attribute Value Colors settings:
- The full swimlane row background uses None Color when enabled (see None Color).
- Missing (
undefined/null) or empty ('') value segments also use None Color when enabled. - If Static Color is enabled, non-empty values use the attribute base color.
- Otherwise, per-value text color mappings are used.
Swimlane Key
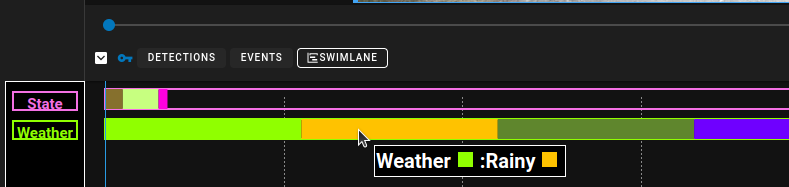
When viewing the swimlane graph, use the key icon in the timeline controls to show or hide the legend column on the left side of the timeline charts. The legend is rendered inline inside the timeline area (to the left of the chart data), with rows aligned to each swimlane attribute.
When the legend is open, section titles above custom swimlane and attribute graph charts are hidden automatically; labels appear in the legend column instead. Detection timelines show a vertically centered title in the legend—hover to see track type colors. Multi-attribute number graphs show a centered title with attribute names and colors on hover. Swimlane row labels align directly with their corresponding swimlane bars.
Hovering over an attribute label in the legend shows the colors associated with that attribute and its values. Hovering over any color in the swimlane shows the attribute name, value, and color.
Legend visibility can also be configured globally in UI Settings → Timeline or via Configuration JSON:
- Legend Controls — show or hide the key toggle button (default: on).
- Legend Force Open — always show the legend and prevent closing it.
- Legend Hide Toggle — hide the key toggle button (useful with Force Open).
- Key Min/Max Width — constrain the legend column width (defaults: 80–150px, auto-sized from label text).